paperImaging Neuroscience GitHubmibur1/comet docsreadthedocs
Brain-behaviour analyses involve a long chain of analytical decisions: how to clean the data, which atlas to parcellate with, how to define brain connectivity, or how to model the brain-behaviour association itself. Each analytical decision has several defensible options, and published papers often report exactly one path through that decision space. This introduces potential risks, such as results not reproducing well with new data.
One approach to deal with this issue is multiverse analysis. This framework aims to analyse a larger number of defensible analysis pipelines and to report the distribution of the resulting effects rather than a single point estimate. This allows researchers to gain a better understanding for which decisions actually influence the result.
However, implementing and running hundreds or thousands of analytical pipelines in parallel is a lot of engineering, and simply creating many results does not really tell you anything about what to infer from them. To help researchers with this, we developed the Comet Toolbox, which is a Python package pairing a suite of network neuroscience methods with a method-agnostic multiverse framework. This multiverse module wraps any analysis pipeline, so it isn’t limited to the methods that ship with the toolbox.
As an example, we showcase a multiverse analysis of a recently published preprint by Popp et al. (2026), which reports (among other things) that higher neuroticism trait scores go with greater heterogeneity in movie-evoked brain responses. We stress-test this finding in a multiverse analysis consisting of almost 2000 analysis pipelines:
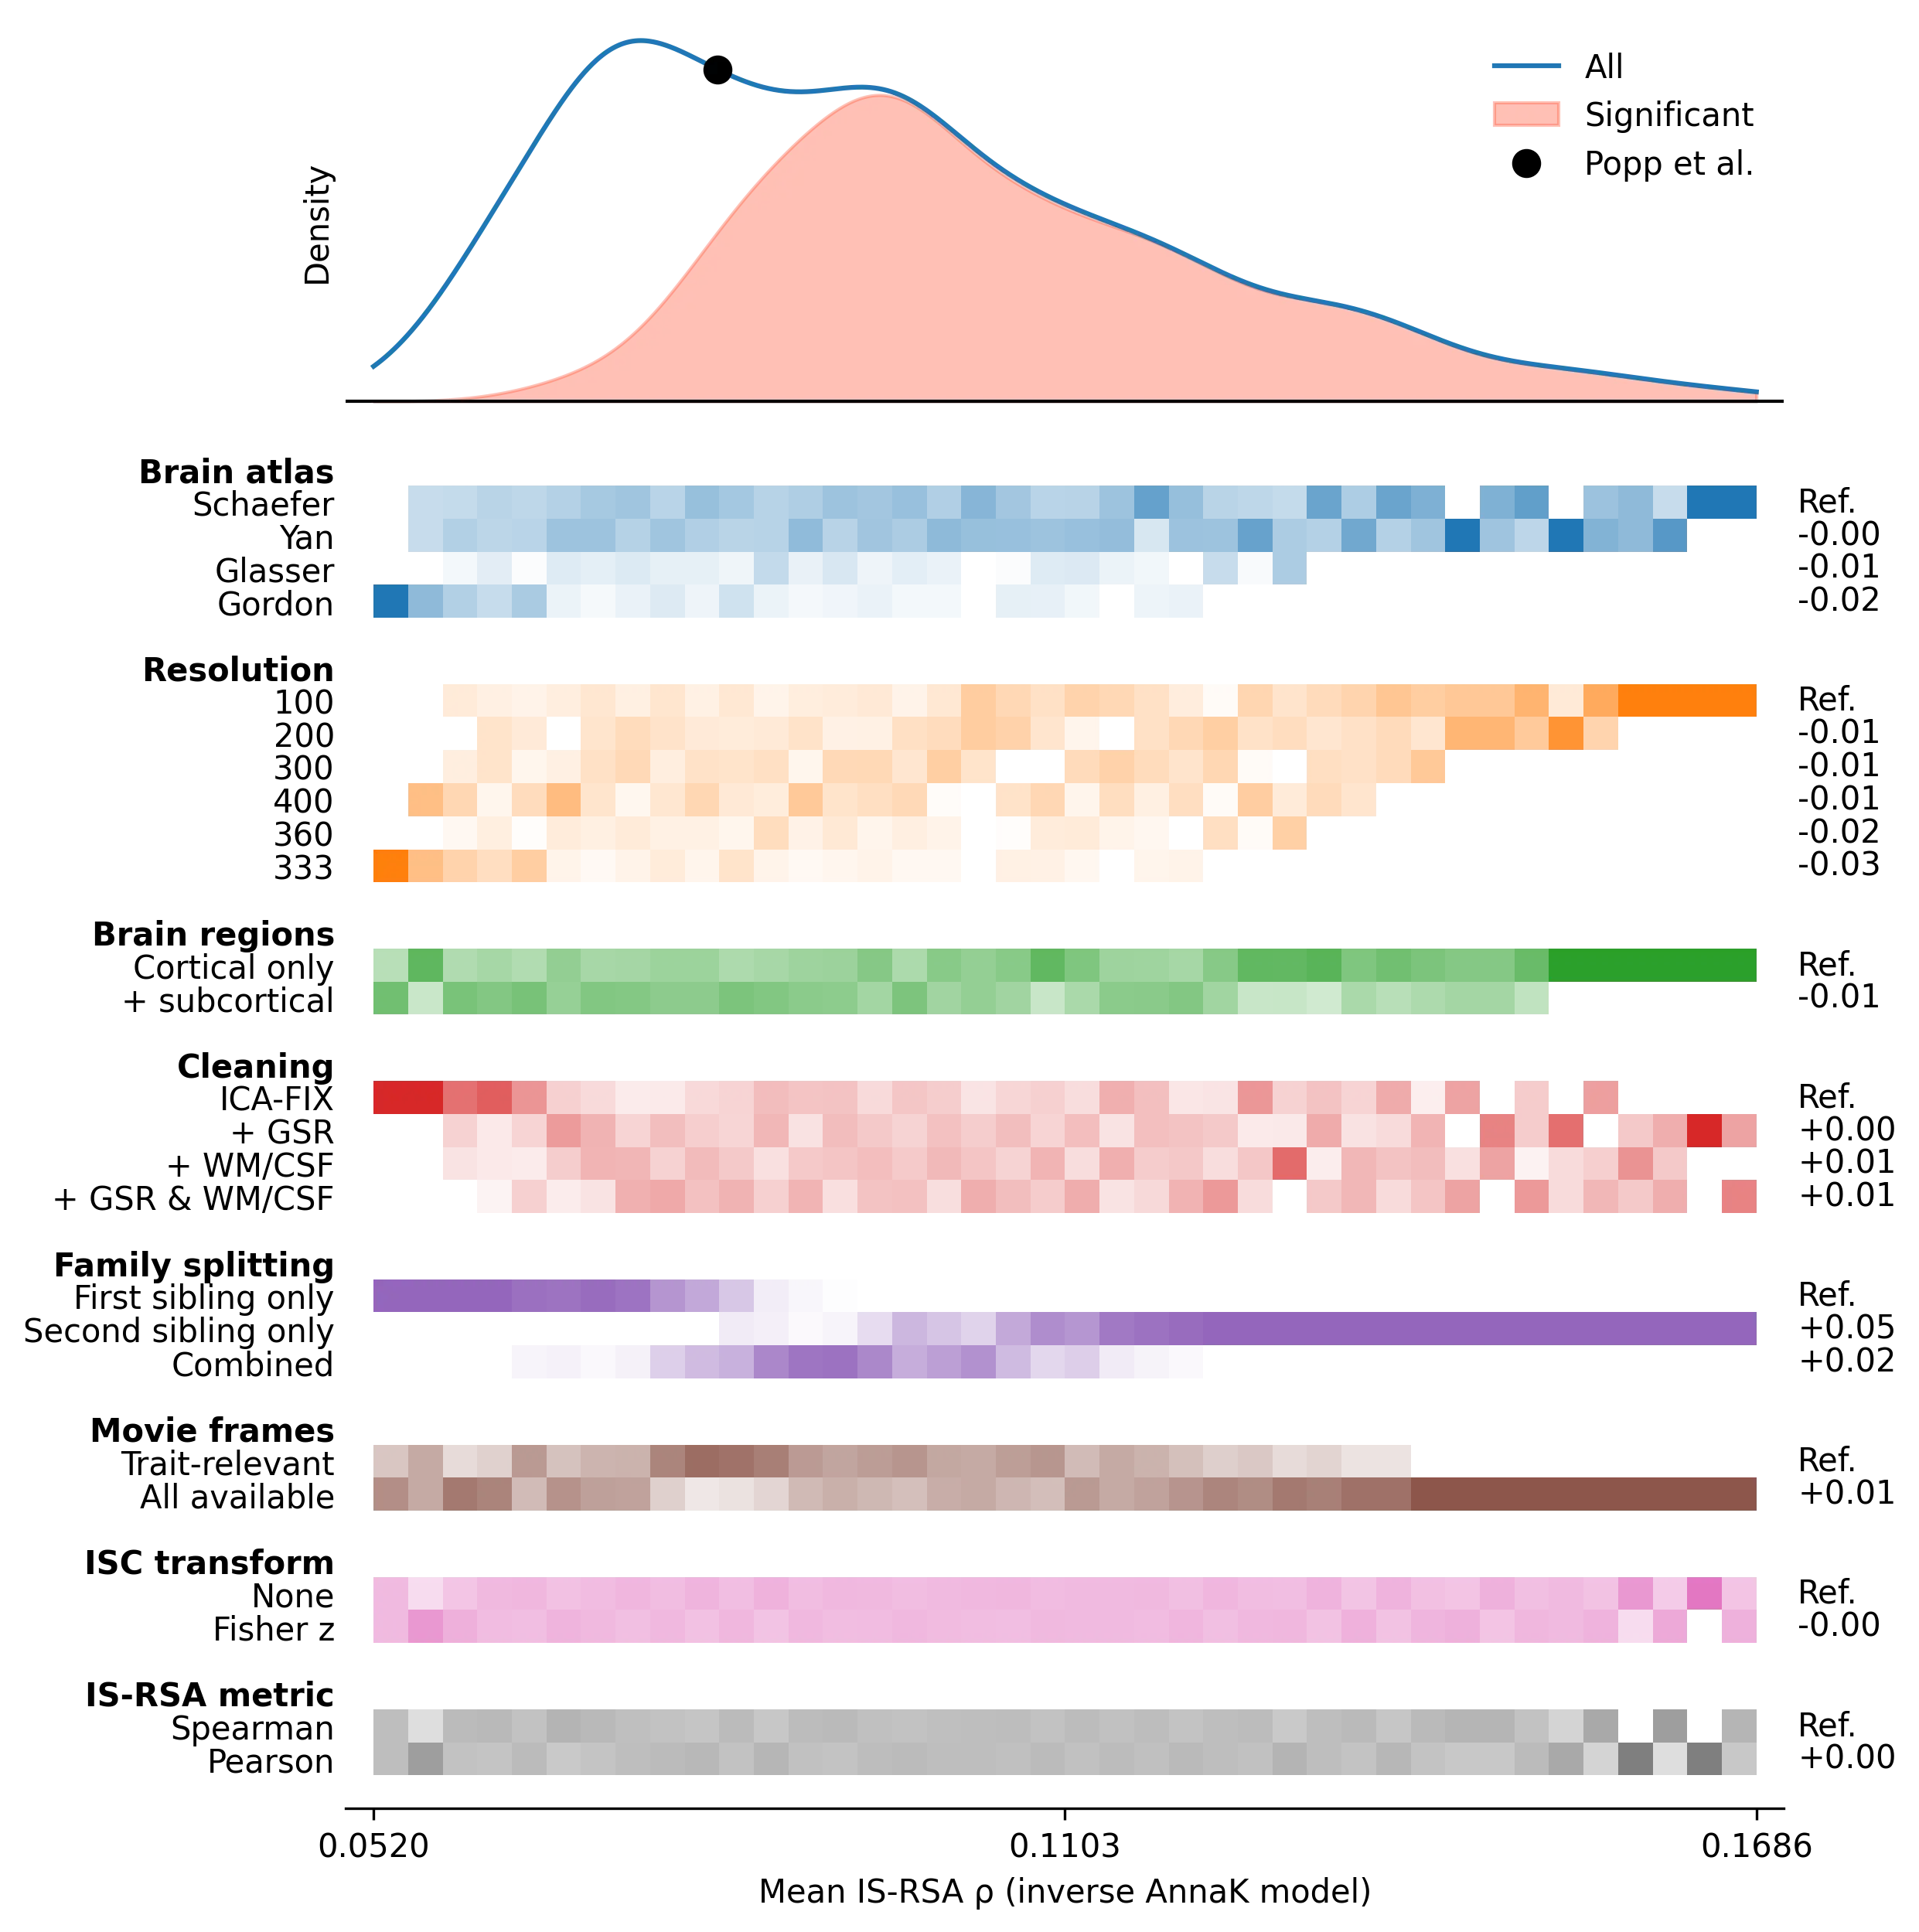
In this figure, it becomes visible that, across all 1920 universes, the effect stays positive, and it is statistically significant in the majority of them.
One interesting part is which decisions actually matter. For example, how the sibling pairs are split has (expectedly) a pretty large influence on the effect. Other decisions like the choice of the brain atlas have a smaller influence, but they might still show a trend such as coarser parcellations tending to produce larger effects.
This result can then be used as a starting point for further analyses, such as using the observed patterns to form better theories, or to apply integration techniques aiming to integrate the multiverse results into a single answer. Many of these extensions are active areas of research.