As data scientists, you often have to work with huge amounts of data. For example, smart phones produce thousands of measurements a day. Having more information can, in theory, help us make better predictions, but it also brings risks: too many variables can make analyses infeasible, lead to false discoveries, or cause models to learn noise instead of real effects.
The large p issue
Big data refers to large data sets with many predictors which often cannot be processed or analyzed using traditional data processing techniques. For our prediction models, this brings some issues:
While linear models can, in theory, still be applied to such data, the ordinary least squares (OLS) fit becomes unstable as p approaches n, and impossible when p > n. The OLS solution requires inverting the matrix , which is singular when p > n. There are then infinitely many coefficient vectors that fit the training data perfectly.
The large number of features also reduces interpretability, making it more difficult for you as a scientist to understand which predictors truly drive the model’s behaviour.
This is where techniques like linear model selection become into play to refine our models.
Today’s data: Hitters
For practical demonstration, we will use the Hitters dataset. This dataset provides Major League Baseball Data from the 1986 and 1987 seasons. It contains 322 observations of major league players on 20 variables (so it’s not big data, but we can pretend it is). The Research aim is to predict a baseball player’s salary on the basis of various predictors associated with the performance in the previous year. You can check its contents here: https://
import statsmodels.api as sm

# Get the data
hitters = sm.datasets.get_rdataset("Hitters", "ISLR").data
For computational reasons, we will not include all predictors but only a smaller subset:
# Keep a total of 10 variables - the target ´Salary´ and 9  features.
hitters_subset = hitters[["Salary", "CHits", "CAtBat", "CRuns", "CWalks", "Assists", "Hits", "HmRun", "Years", "Errors"]].copy()

# Remove rows with missing values
hitters_subset.dropna(inplace=True)

hitters_subset.head()Let’s also take a look at the correlation matrix to check for potential multicollinearity, which can affect the stability of linear regression models.
import seaborn as sns

sns.heatmap(hitters_subset.corr(), annot=True, cmap="coolwarm", fmt=".2f");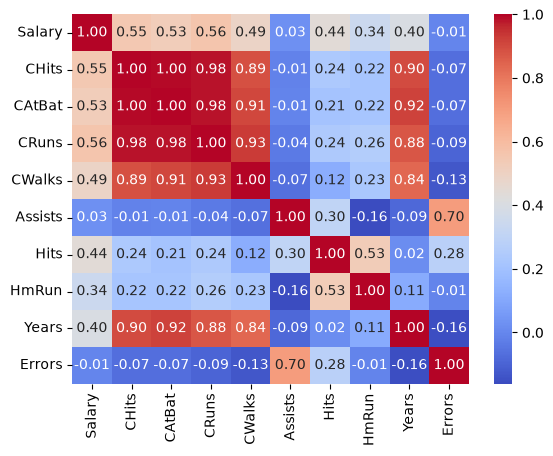
The heatmap reveals strong correlations between several predictors:
CHitsandCAtBatcorrelate at 0.995 (displayed as 1.00 after rounding)CHitsandCRunscorrelate at 0.985
We thus remove two of the correlated features:
features_drop = ["CRuns", "CAtBat"]
hitters_subset = hitters_subset.drop(columns=features_drop)
Handling big data in linear models
Subset Selection
In subset selection we identify a subset of the predictors that are truly related to the outcome. The model is then fitted using least squares on the reduced set of variables.
How do we determine which variables are relevant?
Best Subset Selection
We will start with performing Best Subset Selection (also called exhaustive search) as implemented in the mlxtend package. It has great documentation, e.g. for the exhaustive search. In short, this approach is a brute-force evaluation of feature subsets. A specific performance metric (e.g. MSE, R², or accuracy) is optimized given an arbitrary regressor or classifier. For example, if we have 4 features, the algorithm will evaluate all 15 possible combinations of features (all subsets except the empty one).
Before we start the subset selection, we first define the target and the features:
import numpy as np

y = hitters_subset["Salary"]
X = hitters_subset.drop("Salary", axis=1)
We first split our data into training and test dataset. Although the selection function uses cross-validation to identify the best subset of predictors, this evaluation is done during the selection process and can still overfit to the data: when we pick the best of many CV scores, we also pick the subset that got luckiest on these folds. To fairly assess how the final model performs on new data, we split off a test set and use it only after feature selection is complete.
from sklearn.model_selection import train_test_split

X_train, X_test, y_train, y_test = train_test_split(X, y, test_size=0.3, random_state=42)| Purpose | What is it for? | When? |
|---|---|---|
| Cross Validation in selection function | Helps choose the best subset of features | During selection |
| Test Set Evaluation | Checks how well the final model performs | After selection |
We then run Best Subset Selection on the training data:
from sklearn.linear_model import LinearRegression
from mlxtend.feature_selection import ExhaustiveFeatureSelector

efs = ExhaustiveFeatureSelector(
        estimator=LinearRegression(),
        min_features=1,
        max_features=X_train.shape[1],
        scoring='r2',
        cv=5,
        print_progress=False)

efs.fit(X_train, y_train)

print('Best R²: %.2f' % efs.best_score_)
print('Best subset (indices):', efs.best_idx_)
print('Best subset (corresponding names):', efs.best_feature_names_)
Best R²: 0.41
Best subset (indices): (1, 3, 4)
Best subset (corresponding names): ('CWalks', 'Hits', 'HmRun')
If you are interested in the details, they are stored in the metric dictionary:
import pandas as pd

df = pd.DataFrame.from_dict(efs.get_metric_dict()).T
df.sort_values('avg_score', inplace=True, ascending=False)
dfBecause the exhaustive search evaluated every subset, we can also draw the picture that motivates the whole chapter: how good is the best model of each size?
Source
import numpy as np
import matplotlib.pyplot as plt

results = pd.DataFrame.from_dict(efs.get_metric_dict()).T
results["n_features"] = results["feature_idx"].apply(len)
results["avg_score"] = results["avg_score"].astype(float)

best_per_size = results.groupby("n_features")["avg_score"].max()
sizes = best_per_size.index.to_numpy()

fig, ax = plt.subplots(figsize=(7, 4.5))
ax.scatter(results["n_features"], results["avg_score"], s=14, alpha=0.25,
           color="grey", label="every evaluated subset")
ax.plot(sizes, best_per_size.values, "o-", color="#4c72b0", lw=2,
        label="best subset of that size")

best_size = int(best_per_size.idxmax())
ax.axvline(best_size, color="crimson", ls="--", alpha=0.7)
ax.annotate(f"best overall: {best_size} features",
            xy=(best_size, best_per_size.max()),
            xytext=(best_size + 0.3, best_per_size.max() - 0.06), color="crimson")

ax.set(xlabel="Number of features in the model", ylabel="Cross-validated R²",
       title="Best subset selection on the Hitters data", xticks=sizes)
ax.legend()
plt.tight_layout()

print(f"Number of subsets evaluated: {len(results)}  (= 2^{X_train.shape[1]} - 1)")
Number of subsets evaluated: 127 (= 2^7 - 1)
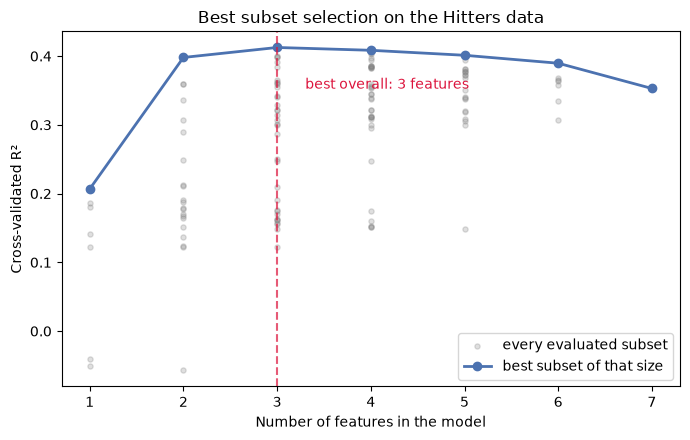
Two things are worth noticing. First, more features do not automatically give a better model. On the training data, adding a feature can never decrease the R², but the cross-validated R² rises, peaks at 3 features, and then declines again. Second, the curve is almost flat between 2 and 6 features. Many different subsets perform about equally well, so we should not over-interpret which exact features end up in the “best” model.
Forward Stepwise Selection
Forward Stepwise Selection is a greedy feature‐selection method that starts with no features and, at each step, adds the single feature whose inclusion most improves the model’s performance. This “add the best remaining feature” is repeated until a desired number of features is reached, at which point the algorithm stops and returns the best subset.
An important parameter is k_features, which determines the number of features to select. We can pass an integer (at most the total number of available features), a tuple (the algorithm will then evaluate all subset sizes between the min and max value), or one of two string options ("best", or "parsimonious"). Please refer to the documentation for further details.
from mlxtend.feature_selection import SequentialFeatureSelector

sfs_forward = SequentialFeatureSelector(
    estimator=LinearRegression(),
    k_features=(1, X_train.shape[1]),
    forward=True,
    scoring='r2',
    cv=5,
    verbose=0)

sfs_forward.fit(X_train, y_train)

print(f">> Forward SFS:")
print(f"   Best CV R²      : {sfs_forward.k_score_:.3f}")
print(f"   Optimal # feats : {len(sfs_forward.k_feature_idx_)}")
print(f"   Feature indices : {sfs_forward.k_feature_idx_}")
print(f"   Feature names   : {sfs_forward.k_feature_names_}")
>> Forward SFS:
Best CV R² : 0.413
Optimal # feats : 3
Feature indices : (1, 3, 4)
Feature names : ('CWalks', 'Hits', 'HmRun')
You can see we ended up with the same three predictors as in best subset selection: CWalks, Hits, HmRun. However, this is not necessarily always the case! Best subset and stepwise selection can, and often will, lead to different results. In our case we only had a small number of predictors, which makes it more likely to end up with the same subset.
Backward Stepwise Selection
Backward Stepwise Selection begins with the full feature set and, at each step, removes the single feature whose exclusion most improves (or least harms) model performance. We keep repeating this “remove the worst feature” step until only the desired number of features remains, and then the algorithm returns that reduced subset:
sfs_backward = SequentialFeatureSelector(
    estimator=LinearRegression(),
    k_features=(1, X_train.shape[1]),
    forward=False,
    floating=False,
    scoring='r2',
    cv=5,
    verbose=0)

sfs_backward.fit(X_train, y_train)

print(f"<< Backward SFS:")
print(f"   Best CV R²      : {sfs_backward.k_score_:.3f}")
print(f"   Optimal # feats : {len(sfs_backward.k_feature_idx_)}")
print(f"   Feature indices : {sfs_backward.k_feature_idx_}")
print(f"   Feature names   : {sfs_backward.k_feature_names_}")
<< Backward SFS:
Best CV R² : 0.413
Optimal # feats : 3
Feature indices : (1, 3, 4)
Feature names : ('CWalks', 'Hits', 'HmRun')
Summary
| Selection method | Finds the best subset? | Computational cost | Works for p > n? |
|---|---|---|---|
| Best subset | Yes (best CV score among all subsets) | Very high: models | No |
| Forward stepwise | Not guaranteed | Low: about models | Yes, for models with fewer than n features |
| Backward stepwise | Not guaranteed | Low: about models | No, because it starts by fitting the full model |
What next?
All three procedures converged on the same three predictors here, so let’s evaluate the model performance and estimate the true test error using that subset.
import numpy as np
from sklearn.metrics import mean_squared_error, r2_score
from sklearn.linear_model import LinearRegression

selected_features = list(sfs_forward.k_feature_names_)

# Subset the data
X_train_subset = X_train[selected_features]
X_test_subset = X_test[selected_features]

# Fit the model
model = LinearRegression()
model.fit(X_train_subset, y_train)

# Get predictions and performance
y_pred = model.predict(X_test_subset)

mse_test = mean_squared_error(y_test, y_pred)
rmse_test = np.sqrt(mse_test)
r2_test = r2_score(y_test, y_pred)

print(f"Test MSE:  {mse_test:.2f}")
print(f"Test RMSE: {rmse_test:.2f}")
print(f"Test R²:   {r2_test:.4f}")
Test MSE: 182321.00
Test RMSE: 426.99
Test R²: 0.2492
So in sum:
The typical prediction error (RMSE) is about 427, i.e. 427 thousand dollars (salaries are given in thousands).
Our model explains about 25% of the variance in salary in the test set.
But did the selection actually help? For comparison, let’s evaluate the full model with all 7 features on the same test set:
full_model = LinearRegression().fit(X_train, y_train)
print(f"Test R² (all 7 features):     {full_model.score(X_test, y_test):.4f}")
print(f"Test R² (3 selected features): {r2_test:.4f}")
Test R² (all 7 features): 0.2864
Test R² (3 selected features): 0.2492
The full model is not worse. Subset selection gave us a simpler model with 3 instead of 7 predictors, but not a better one. With only 79 players in the test set, a difference of this size could also be due to chance. This is typical: subset selection mainly makes models simpler and easier to interpret, but it does not guarantee better predictions.
Regularization and Dimensionality Reduction
As mentioned before, regularization and dimensionality reduction are two other ways of dealing with large numbers of predictors. Regularization is covered in the next chapter, and dimensionality reduction in the 🔎 PCA, PCR & PLS session.